
Table of Contents
There is one number many merchants have never seen and which nonetheless helps decide their liquidity: the stock value sitting in the warehouse beyond actual need. A byrd customer recently saw that number for the first time. It read €442,000. Found with a single prompt, in under a minute.
Overstock is something different from a slow mover. Slow movers do not sell. Overstock often affects products that sell perfectly well, but of which simply too much was bought: three years of supply for a product ordered twice a week. The goods are good; the quantity is the problem.
The problem: over-ordering feels safe
Large orders look sensible.
Better unit prices, ordering less often, never any stockout fear again. What the calculation leaves out: storage costs over months or years, tied-up capital and the risk that demand turns before the supply is gone.
Hardly anyone knows their coverage per SKU.
As a rule of thumb, depending on product and industry, three to at most six months of coverage counts as healthy. In practice, almost every range contains SKUs with two, five or in the extreme case twenty years of supply. Nobody decided that; it just happened.
Nobody sees the total.
Individually, each case looks small. Only the overall sum across all SKUs shows how much liquidity is really sleeping on the shelves.
How to find your overstock with byrdAI
Once connected, this is all it takes in Claude or ChatGPT:
"Where am I overstocked and how much capital is in it?"
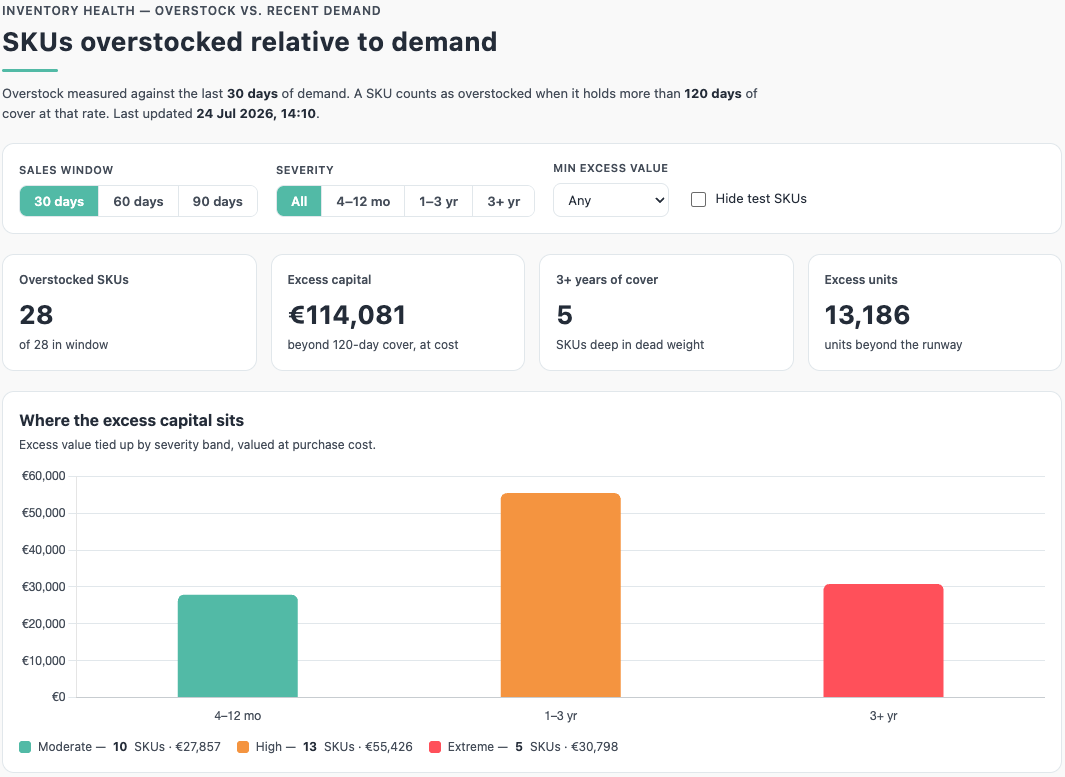
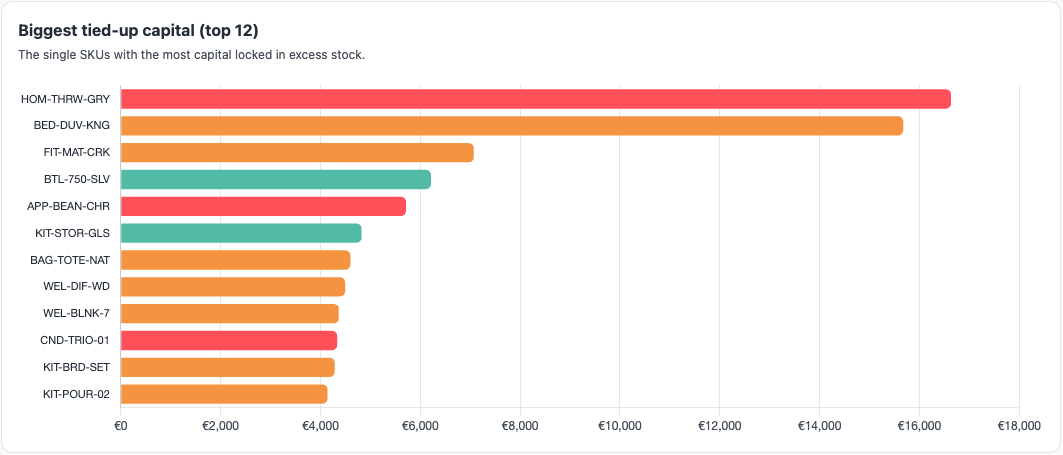
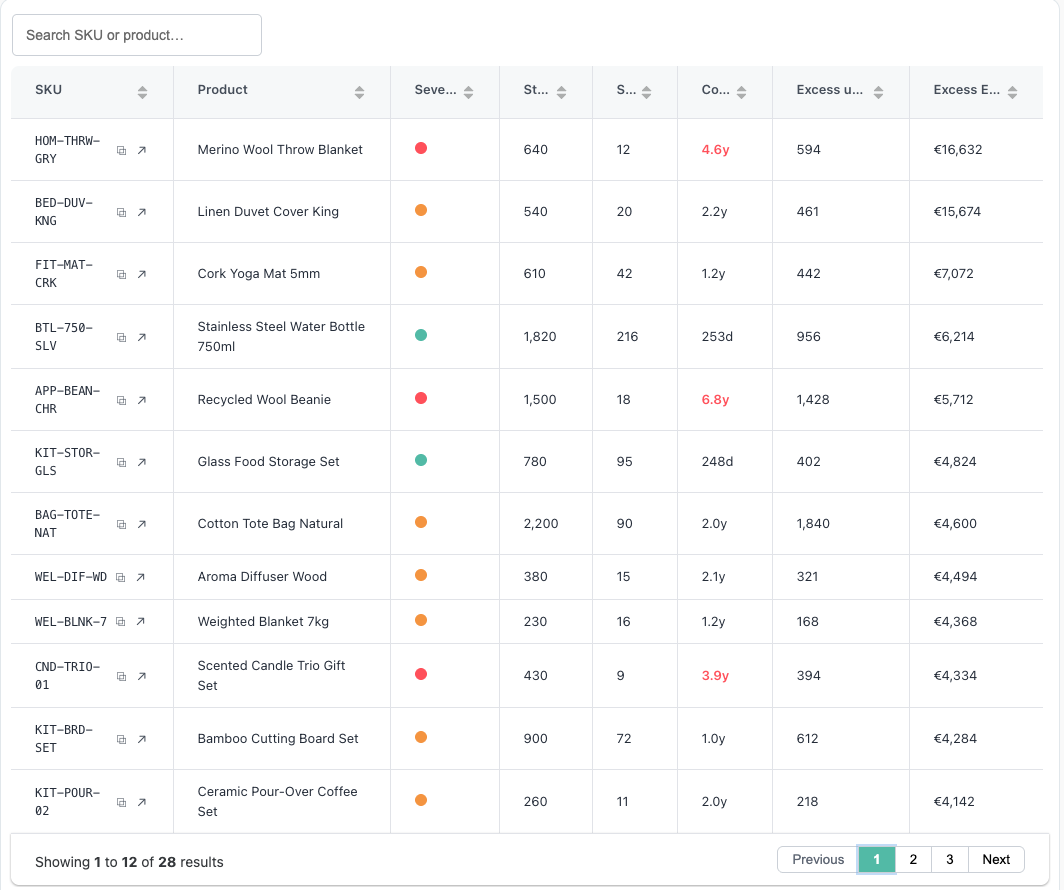
For every SKU, byrdAI compares current stock with the actual sales velocity and shows you what goes beyond a healthy coverage, in units and in euros at purchase price. With the ready-made dashboard prompt from the byrdAI page, that becomes a live dashboard with three severity levels:
- 4 to 12 months of coverage: too much, but readily reduced with promotions.
- 1 to 3 years: here every reorder should be stopped immediately.
- Over 3 years: effectively dead capital. A real-world example: 1,811 units of a product that barely turns, around €9,600 in stock value, a notional coverage of over 20 years.
Which decisions to draw from it
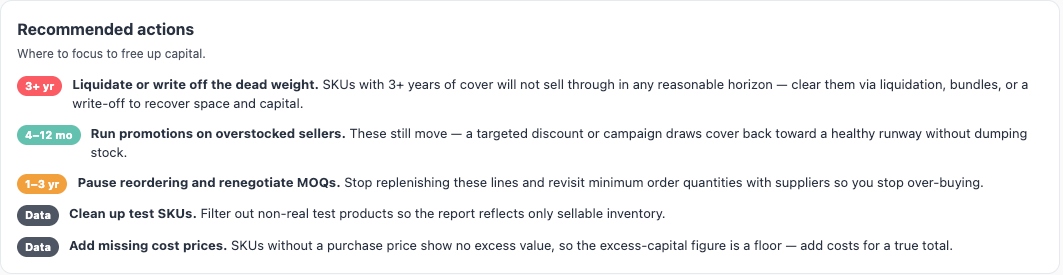
Stop reordering. The fastest win costs nothing: for every SKU from 12 months of coverage upwards, you simply stop ordering until the coverage is healthy again. The reorder planner factors that in automatically.
Sell off with a plan.
For the 4-to-12-month zone, normal levers are enough: promotional pricing, bundles, marketplace deals. The goal is not maximum margin per unit but reclaiming capital and space that earn more elsewhere.
Assess extreme cases honestly.
At three years of coverage and more, the question is no longer "How do I sell this?" but "What is keeping it costing me?" Liquidating, donating or writing off is often cheaper than more years of storage rent.
Adjust purchasing.
The most lasting effect comes before the next order: smaller quantities, more often. If your supplier's minimum order quantities force you into overstock, the report is your argument for the next MOQ negotiation.
From overstock report to routine
The monthly review for purchasing.
"Send me overstock by severity, with the 10 biggest capital tie-ups and the change versus the previous month." The change is the real metric: it shows whether your measures are working.
The purchasing watchdog.
"Warn me before I reorder a product that still has more than 12 months of coverage." The cheapest overstock is the kind that never arises.
The sell-off pipeline.
"From all SKUs with 1 to 3 years of coverage, create a sell-off list with remaining stock, stock value and discount suggestion, as a table for my marketing." The analysis becomes a ready-made campaign basis.
Combined with the ABC analysis.
"Show me overstock only for B- and C-items." For an A-item, a buffer can be strategic. For a C-item, it is just expensive. The ABC analysis provides the classes.
Get an overview of every SKU now
Maybe for you it is not €442,000. Maybe it is €30,000, maybe more. The point is: after a minute you know. As a byrd customer, you connect byrdAI to Claude or ChatGPT in around 5 minutes and copy the overstock prompt from our byrdAI page or below this section. Not a byrd customer yet? byrdAI comes only with byrd fulfilment, as the first European 3PL with an MCP server. Talk to us.
Example prompt for the overstock report (adjust it however you like).
Frequently asked questions about the overstock report with byrdAI
When does stock count as overstock?
By default, the report counts from 120 days of coverage, so anything beyond around four months of supply at the current sell-through. You adjust the threshold to your business by prompt.
What is the difference from the slow-mover report?
Slow movers barely or never sell, a demand problem. Overstock mostly affects products with healthy demand but too large a supply, a purchasing problem. Together, both reports give you the complete picture of your tied-up capital.
How is the overstock value calculated?
Based on the purchase prices maintained in byrd, for the units above the healthy coverage. Where purchase prices are missing, the value is a floor.
What does byrdAI cost?
During the beta, byrdAI is included free in your account for byrd customers.